
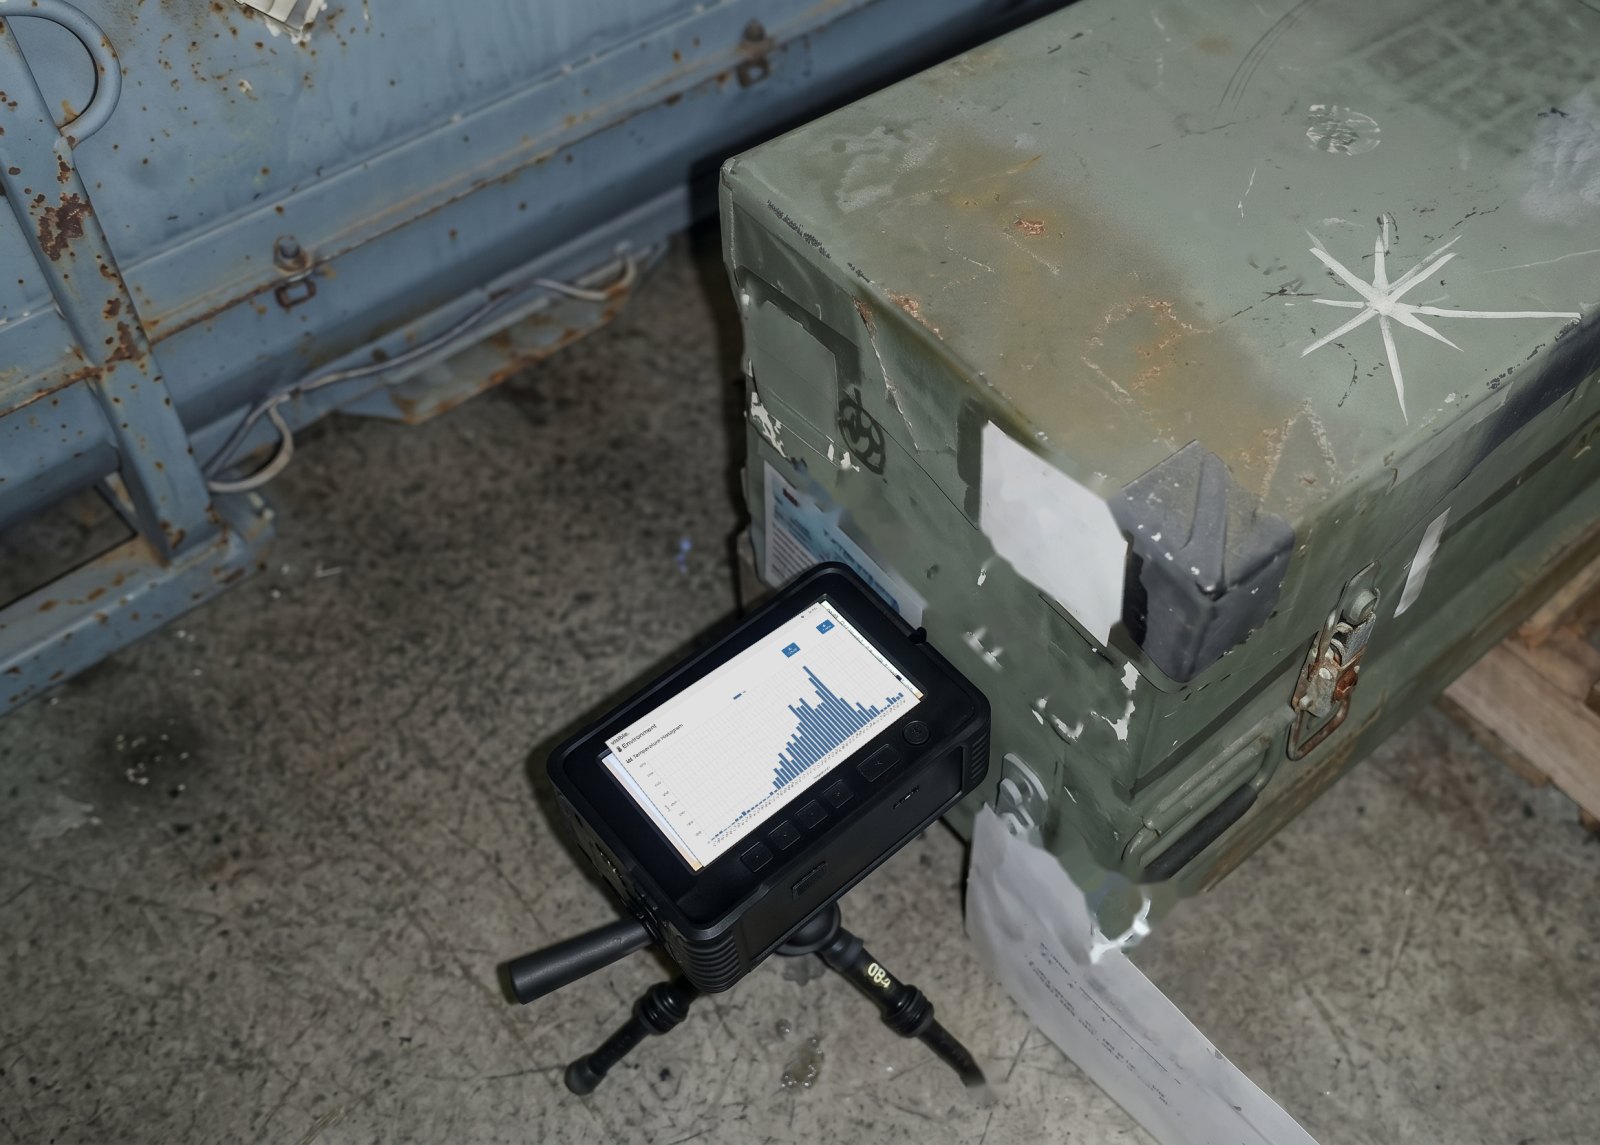
Sensor Envoy® · Integrated Workflow & Reporting
Discover the Group.
Report Every Issue.
Sensor Envoy has moved from R&D tool to front-line use. The new integrated workflow discovers every tag in an asset group, reads every Red Flag through the sealed case, and turns the whole group into excursion reports for management — with only a few clicks.
New · Integrated Workflow
A Whole Asset Group, Read and Reported in Four Steps
It plays by itself — or use the buttons to step through.
Name the asset group
ILLUSTRATIVE SIMULATION · THE REAL APPLICATION SCREENS ARE SHOWN BELOW
Built for the Chain of Command
Reports That Justify the Next Decision
The people working the software aren’t the people approving budgets. Envoy’s excursion reports close that gap: one document per flagged asset that shows management exactly what happened, when, and how badly — and summarizes what needs to be done with the assets already on hand.
- ✓ Whole-group excursion reports in a few clicks
- ✓ Asset groups and discovery sessions — month over month, case by case
- ✓ PDF for people, JSON for systems, a decision log for support
- ✓ Evidence to retire, retest, or justify more coverage
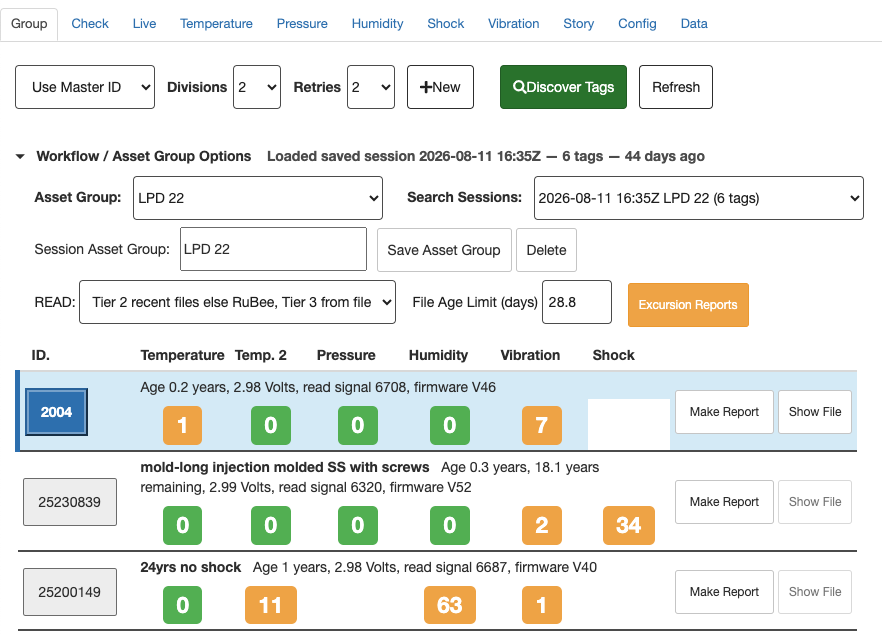
The Group tab. Every discovered tag with its Red Flags, a Make Report button per tag, and Excursion Reports for the whole session.
Real Output · Tag Summary Report
What a report actually looks like
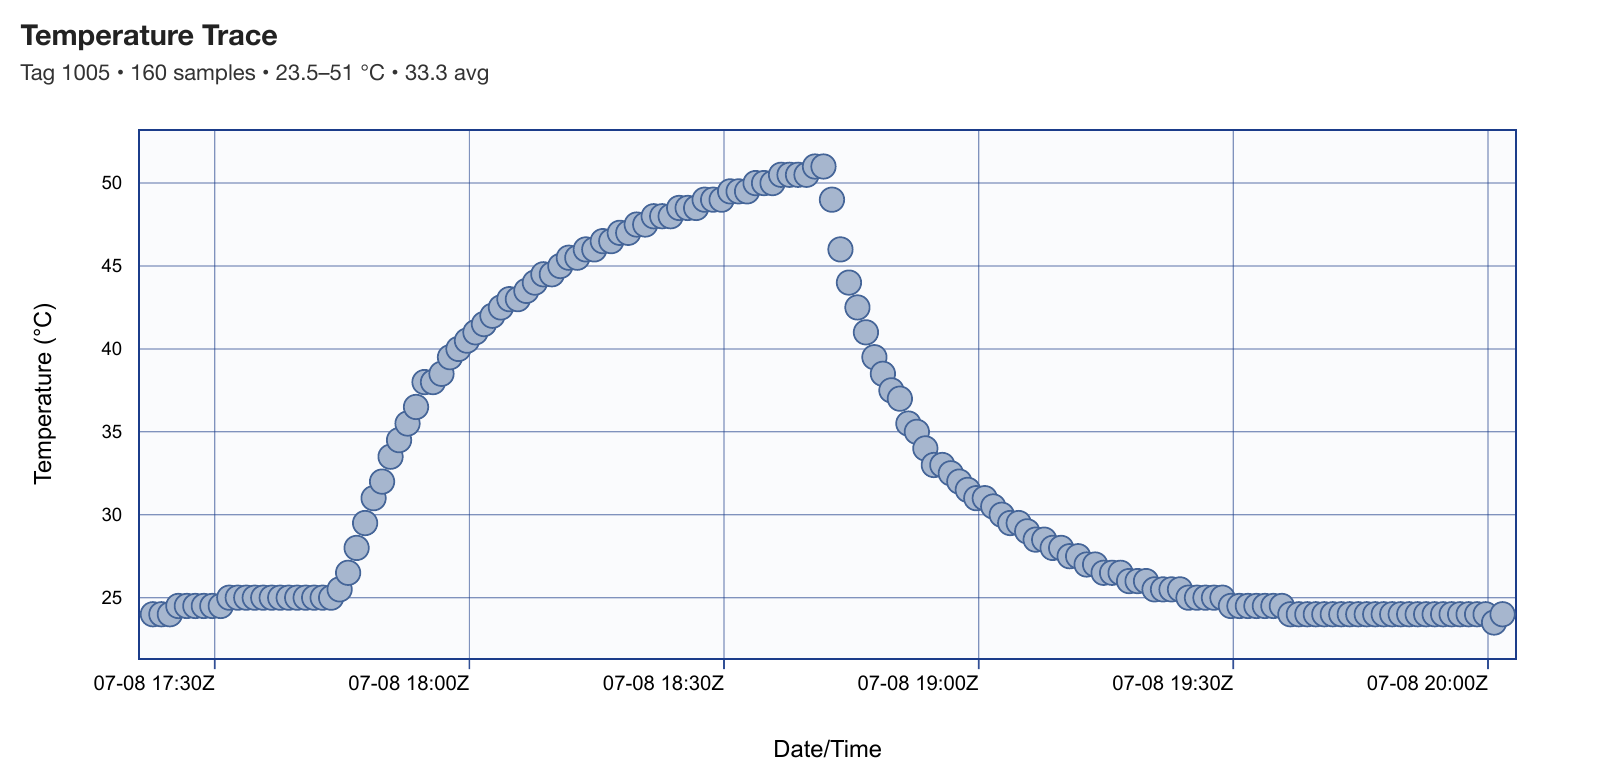
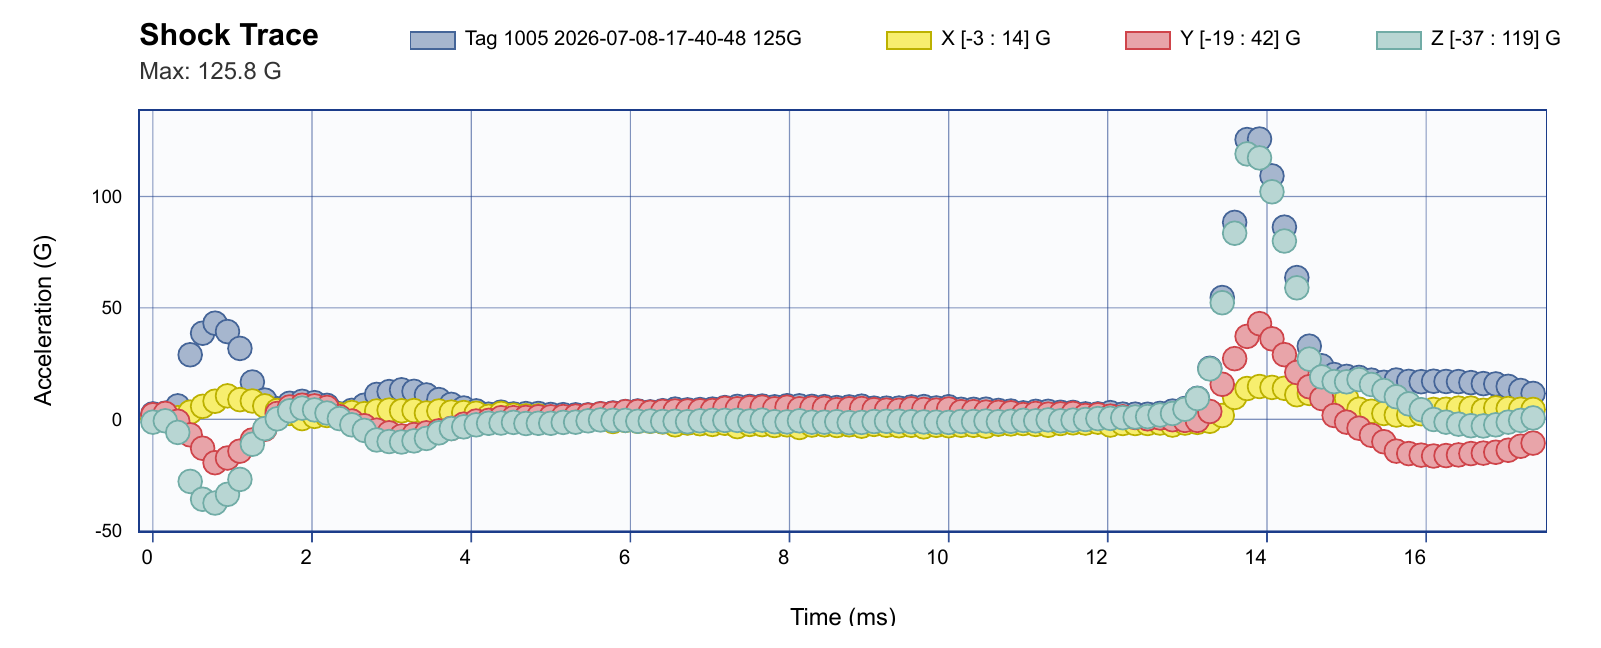
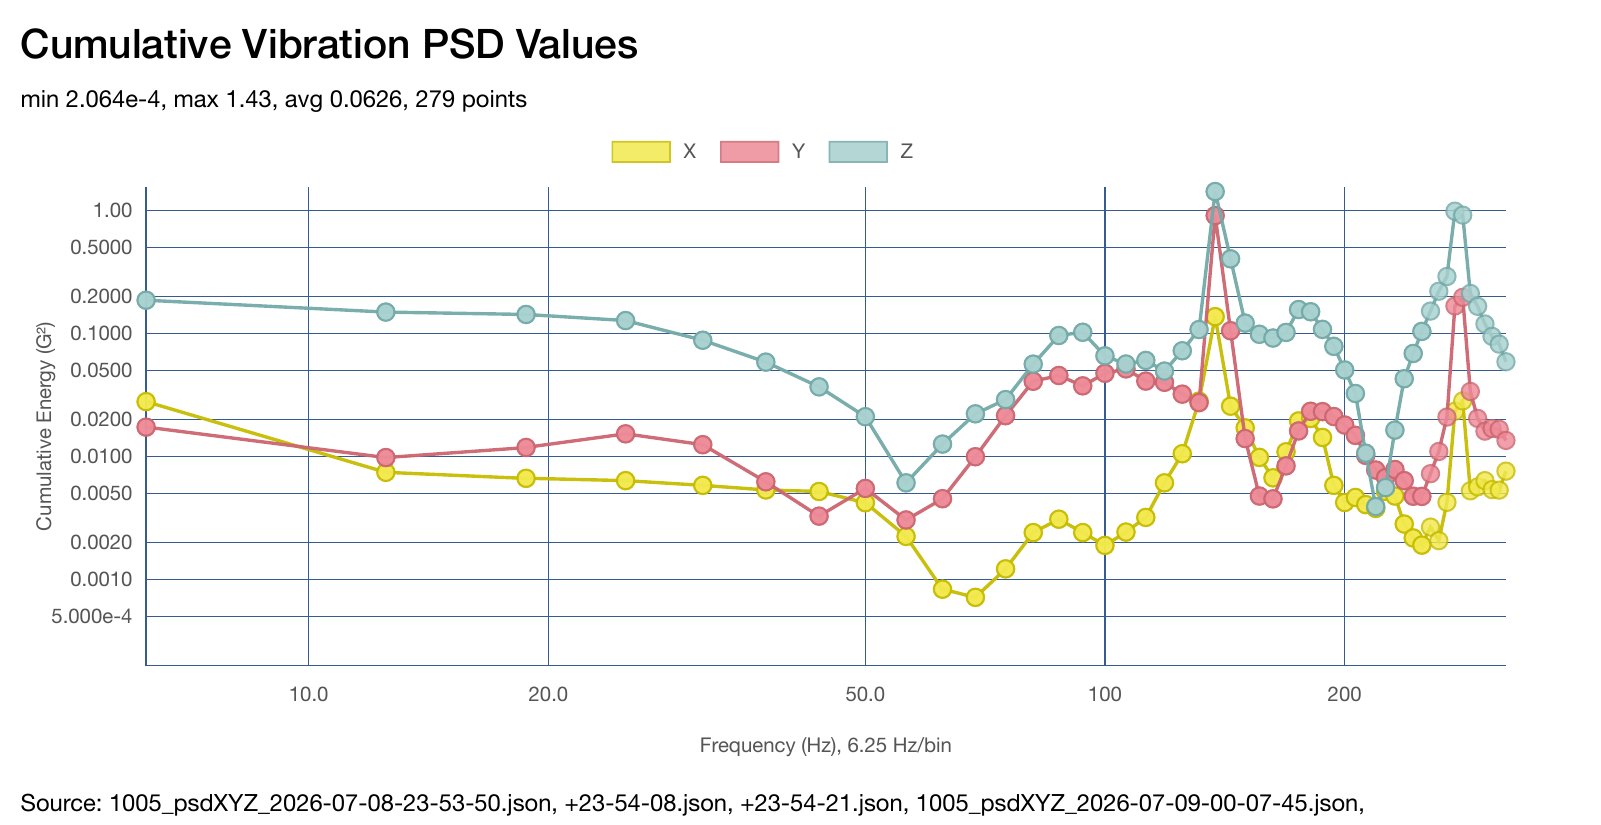
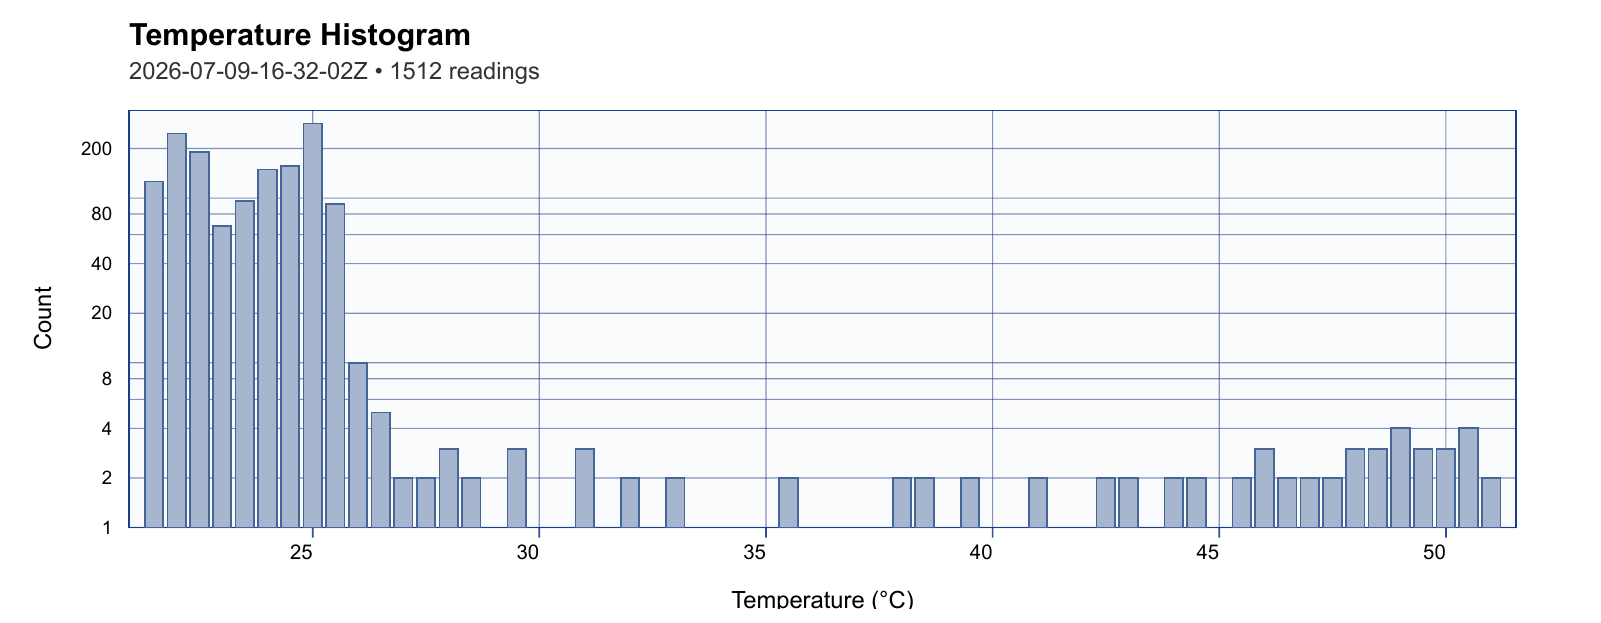
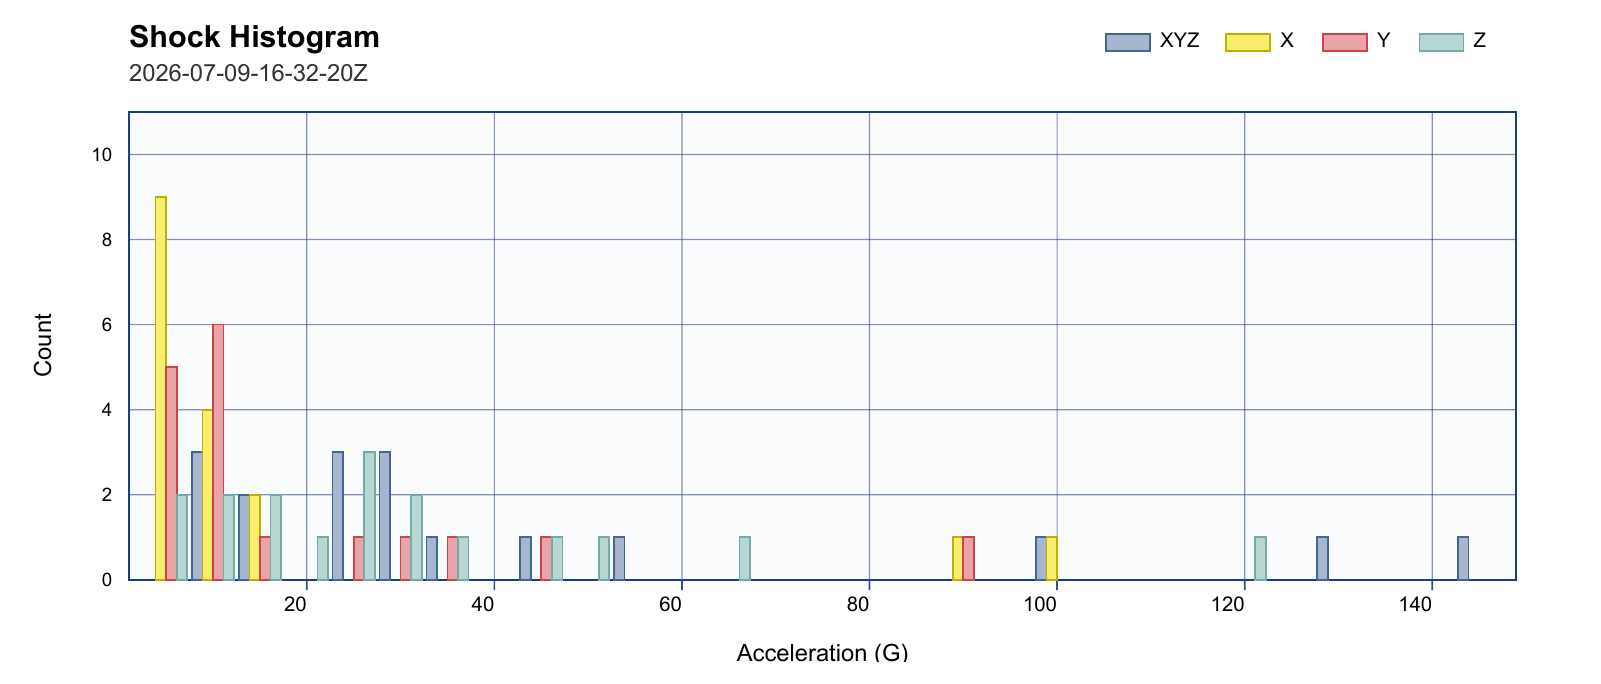
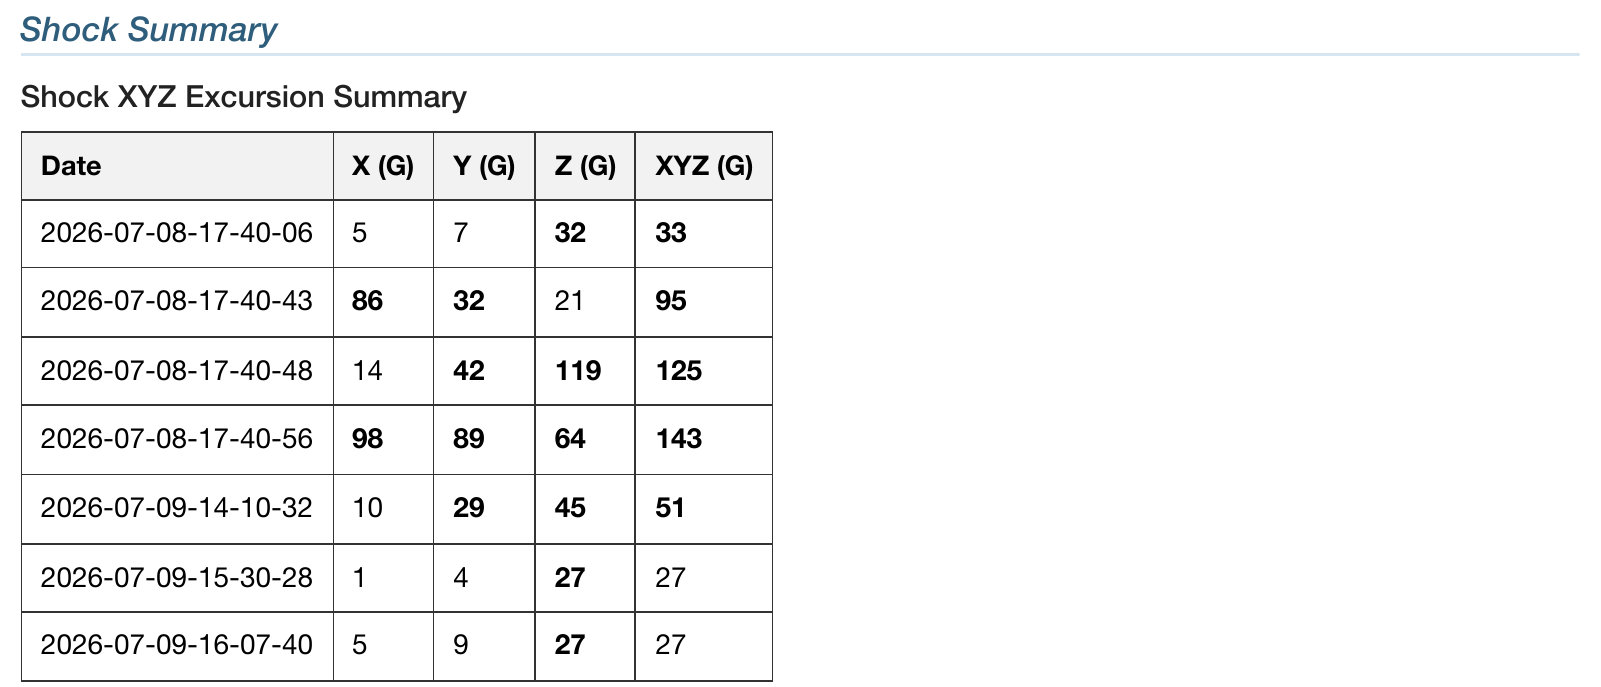
Vector graphs rendered straight from the tag’s own data by Envoy — one tag, one 48-hour session, every channel. Temperature excursion to 50.9 °C, a 125 g shock at 17:40:48 with its 16 ms trace, and the cumulative vibration spectrum.
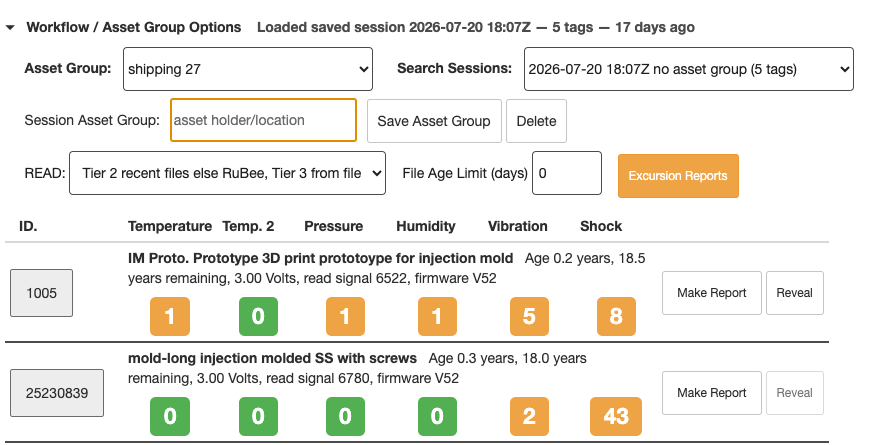
Asset groups & sessions. Name a case or container once, then open a new discovery session for it each time it is checked.
Three Tiers of Tag Data
Read Only as Deep as You Need
To make a 20-year battery possible, the RuBee link moves small 32-bit packets — so the tag stores its data in tiers. Discovery reads the fastest tier for every tag at once; reports pull the second tier automatically; the deepest tier is read on demand and folded into the report.
TIER 1
Red Flags
How many times each sensor crossed its configured threshold. Very fast to read — part of discovery.
TIER 2
Excursion Summaries
Date, time, excursion amount and duration for every flagged event — quick to read, included automatically.
TIER 3
Logs & Traces
Temperature, pressure and humidity logs, shock traces and vibration PSD — read before reporting to include them.
REPORT
PDF + JSON
A PDF that opens automatically, a JSON bundle of every data file used, and a decision log for support.
Interactive · Try the Drill-Down
From Red Flag to Raw Trace in Two Clicks
This is the Envoy workflow on simulated tag data. It runs itself — or take over and click any flagged channel.
SHOCK · LIFETIME HISTOGRAM (LOG SCALE) — CLICK THE OUTLIER
EVENT TRACE · 112 SAMPLES @ 6400 Hz
182.4 g
2026-03-11 14:42:07
OVER 80g — DAMAGING. TARGET ATE.
SIMULATED DATA · THE REAL APPLICATION IS SHOWN IN THE SCREENS BELOW
Inside the Application
Real Screens, Real Tag Data
Thresholds & Red Flags. Set per-channel excursion thresholds before the tag is activated; Envoy reads back standing flags and worst-case monitoring status.
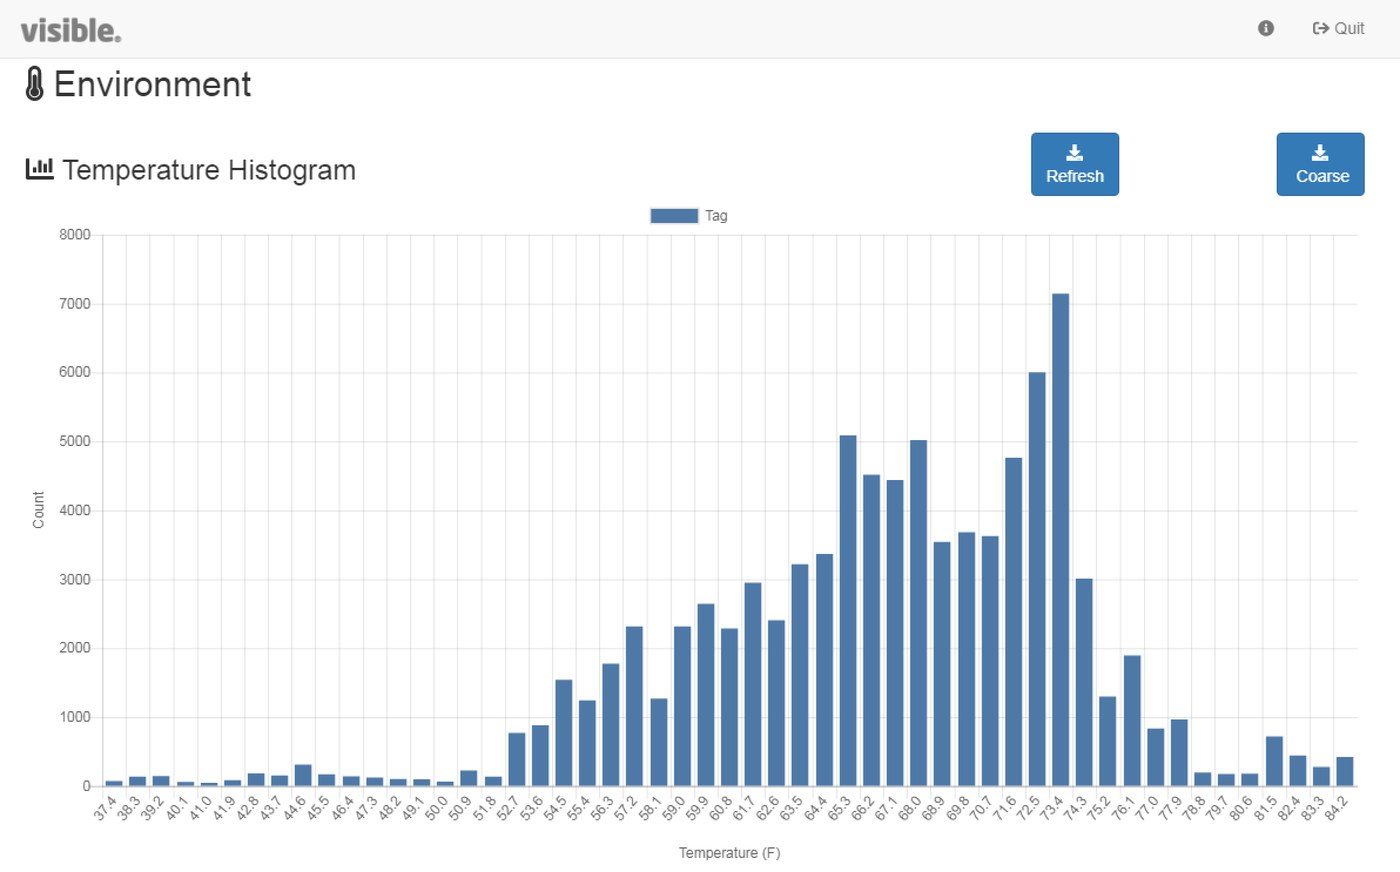
Environment histogram. Log-scale distribution over the tag’s whole life — infrequent extremes stand out immediately.
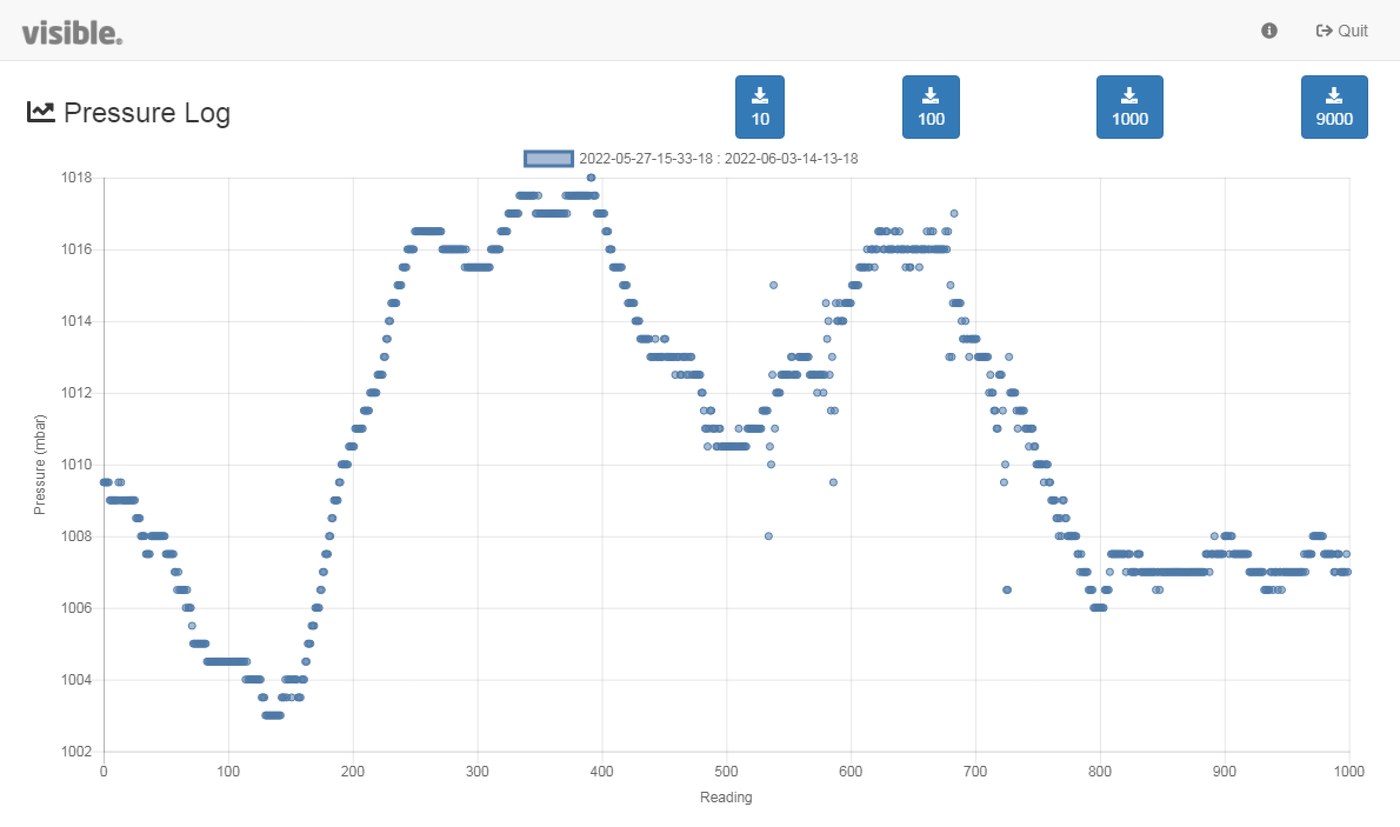
Pressure trace. Two aircraft flights, certified by the altimeter with GMT date and time — takeoff, cruise, landing.
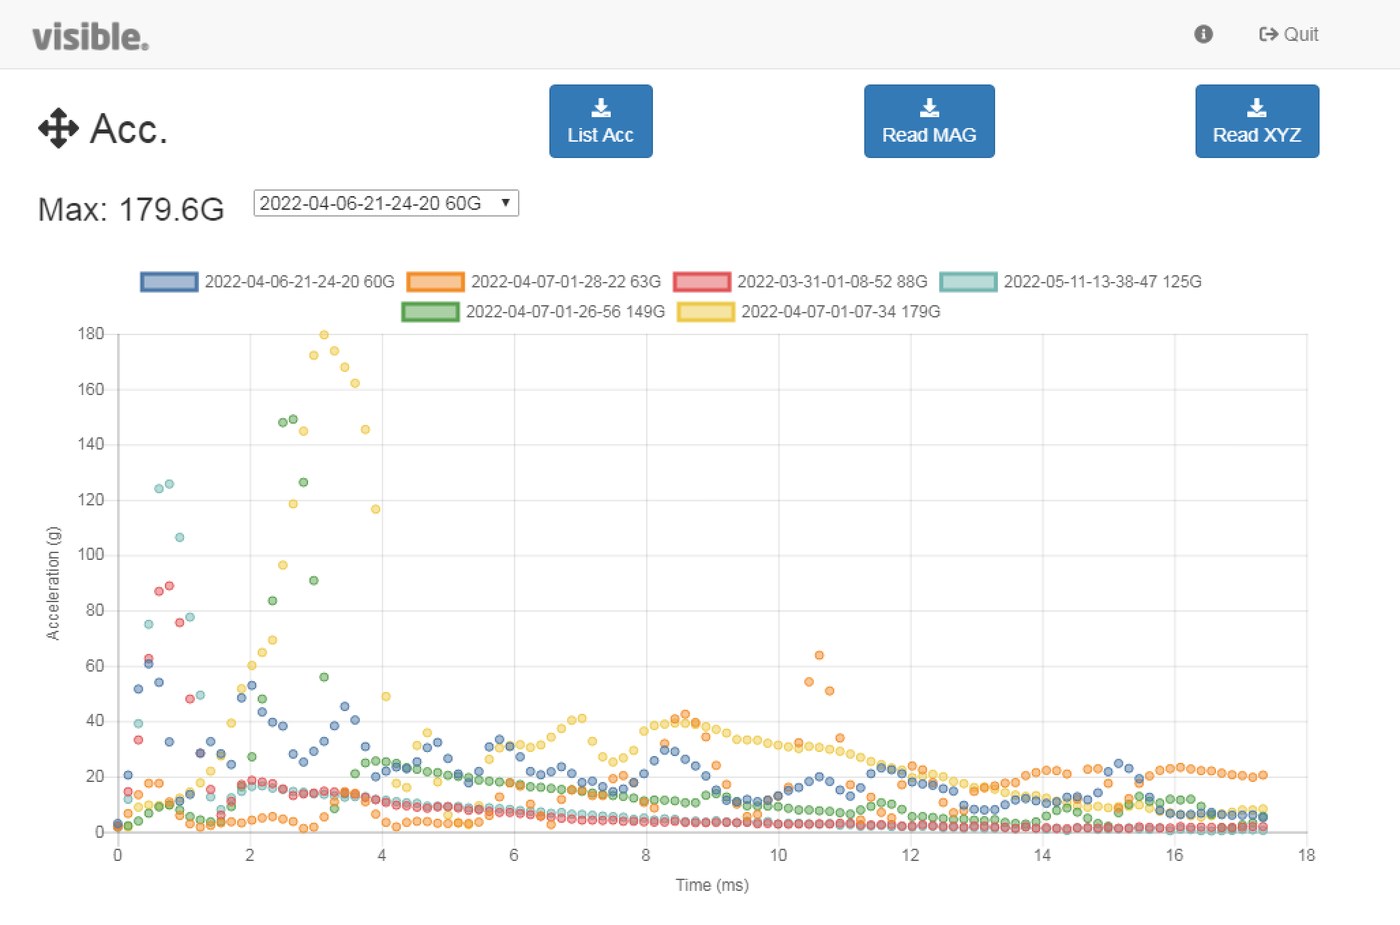
Shock analysis. The 15 worst impacts, listed by magnitude; every trace opens into X/Y/Z waveforms at 6,400 Hz.
Storyboard
Every excursion on one integrated timeline — click any event to load the surrounding temperature, pressure, and humidity log plus the shock trace beneath it. The asset’s life, told in one window.
Vibration PSD
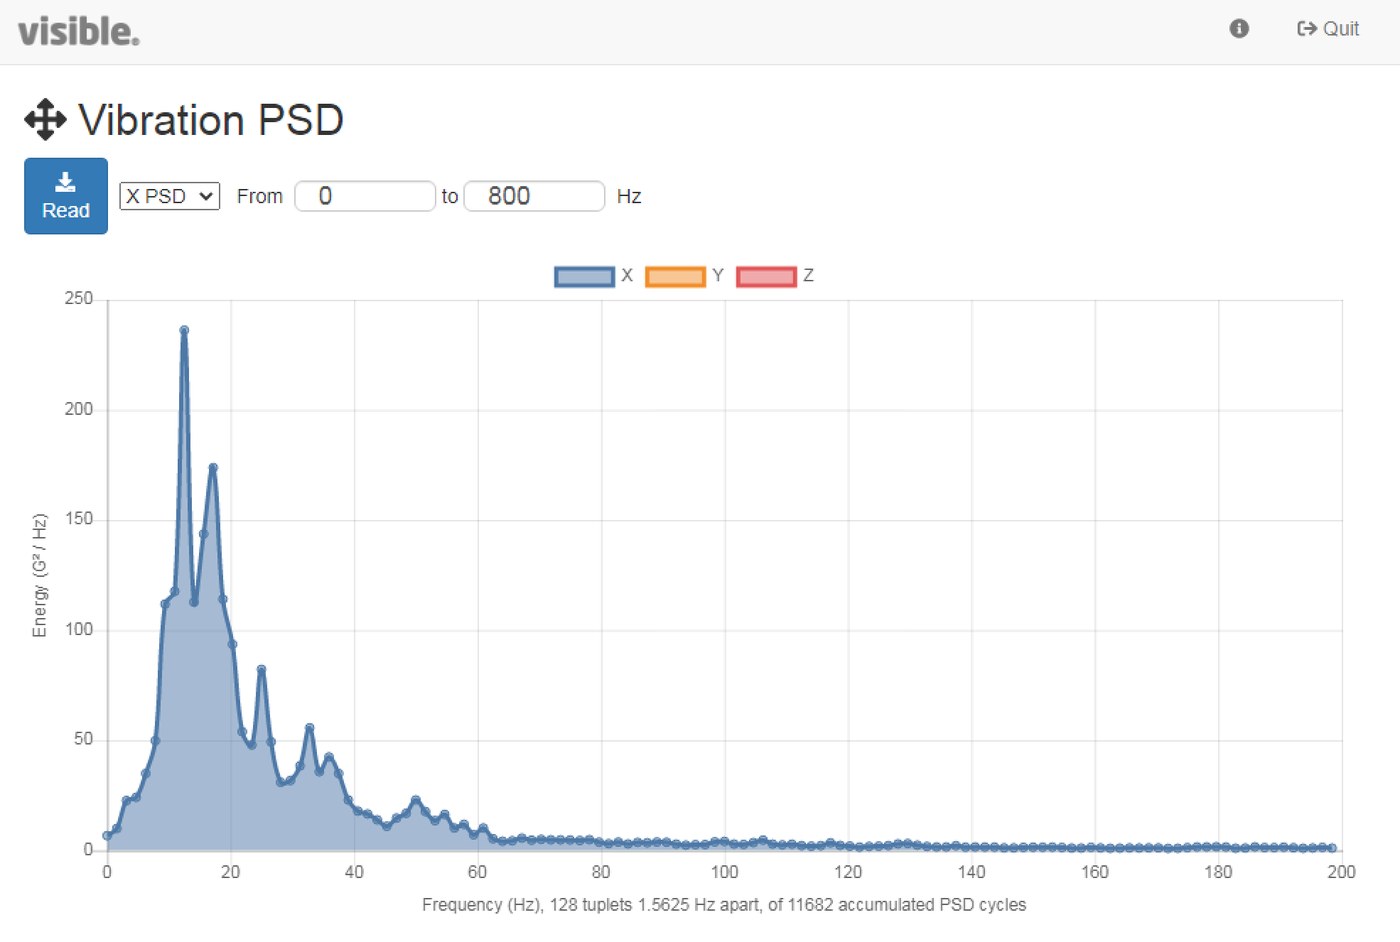
Cumulative Power Spectral Density, 0–750 Hz: the magnitude and frequency signature of lifetime vibration exposure — the diagnostic for motor and electronics fatigue.
Histolog & Arrhenius
A synthesized ~20-year log built from histograms and events, feeding Arrhenius-based service-life estimation — predicted remaining life from actual thermal history.
Scale Up
RuBee.io: Command and Control for the Whole Stockpile
Where Sensor Envoy serves the bench and the bay, RuBee.io is the enterprise layer: in-transit visibility, storage monitoring, asset transfers with direction of travel, and PHM status across every site — standalone or integrated, with satellite backhaul from forward locations.
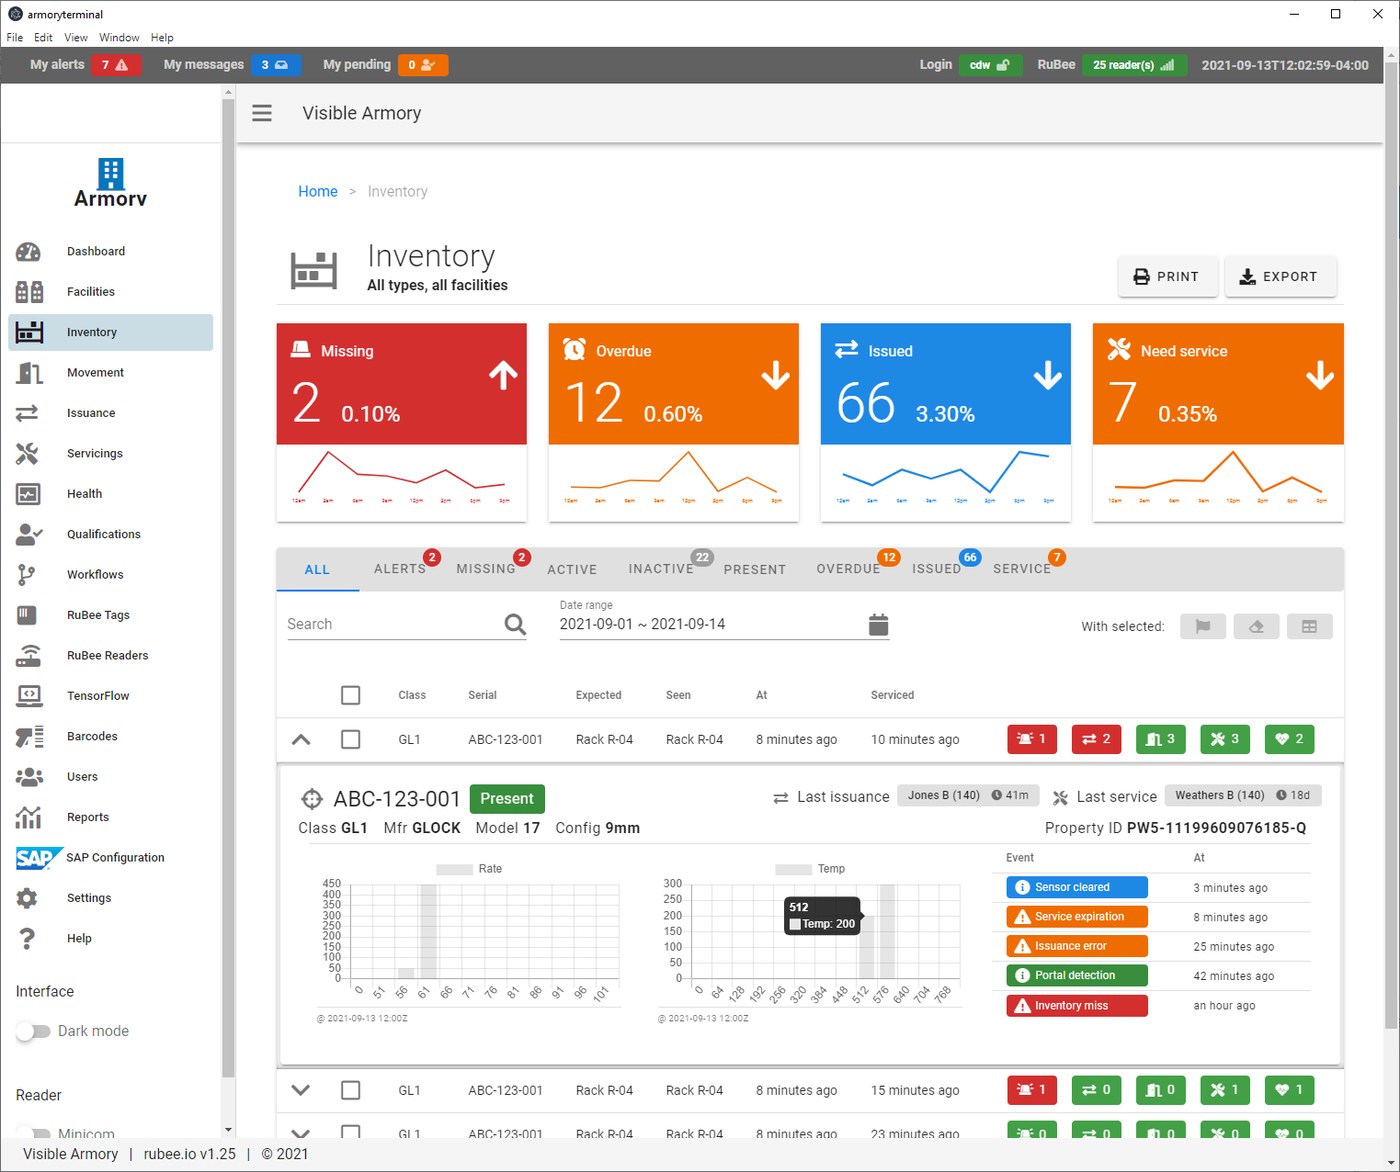
RUBEE.IO · FLEET PHM STATUS
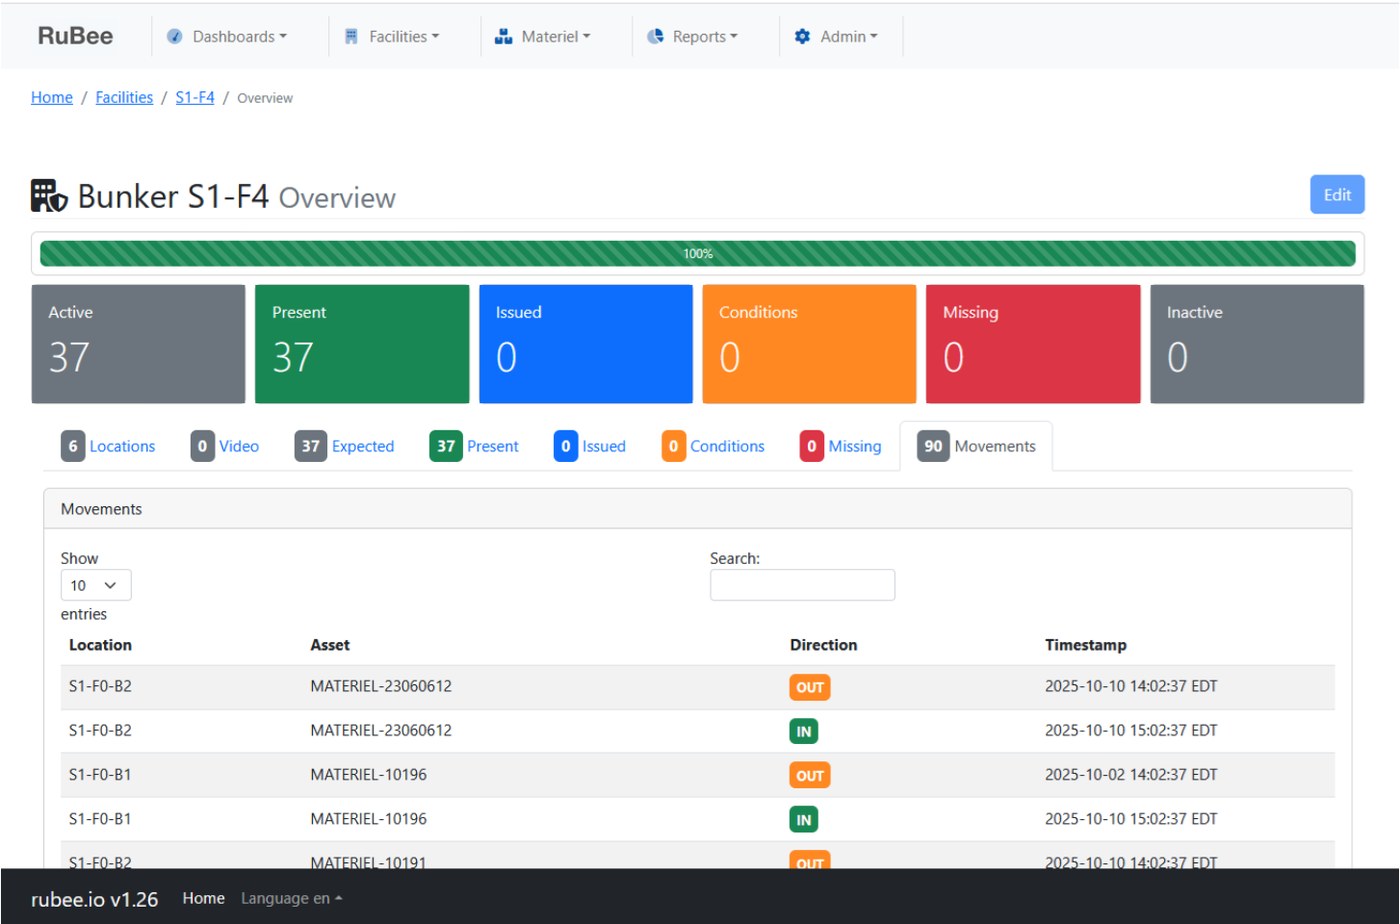
RUBEE.IO · SITE VISIBILITY & TRANSFERS